Visualising GPX hiking data and photos with leaflet
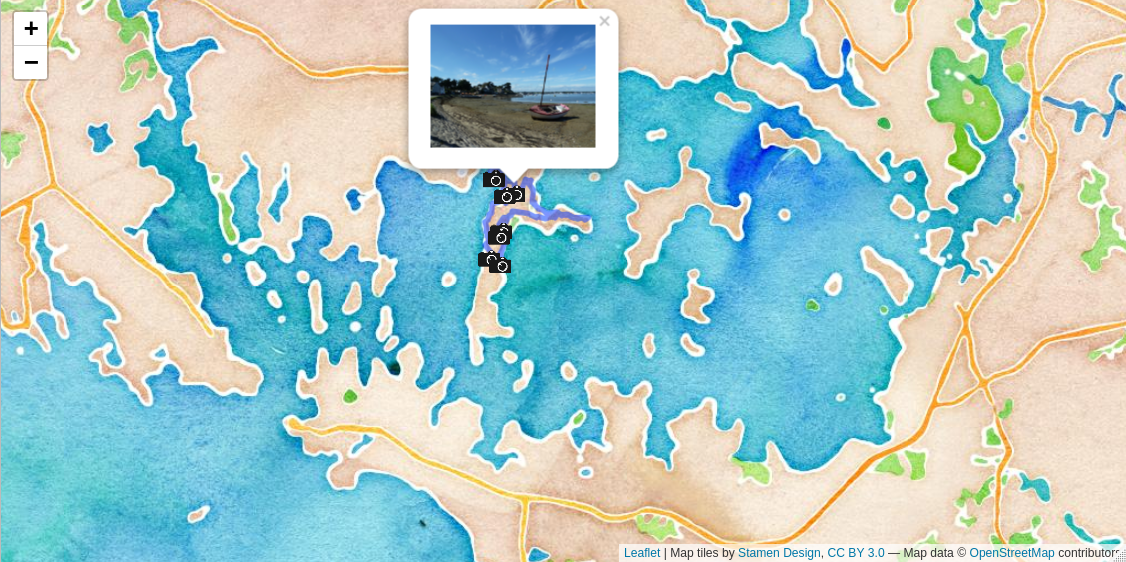
Visualising GPX hiking data and photos with leaflet
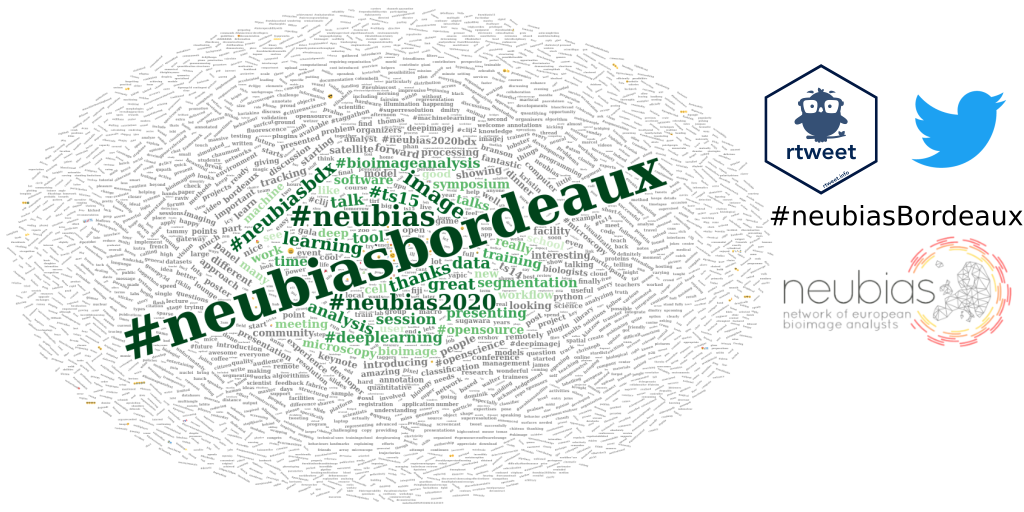
Part 3: Exploring tweets content
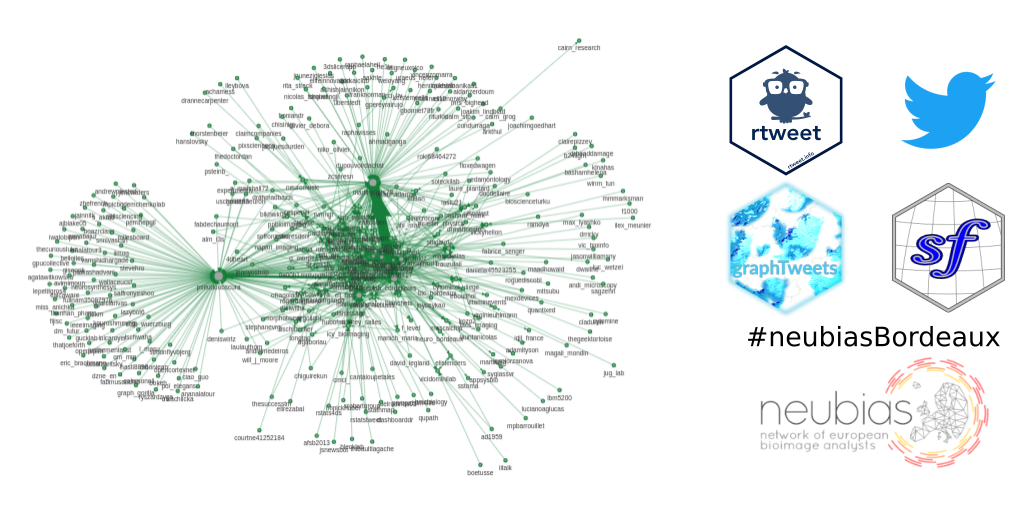
Part 2: Exploring user profiles and relationships
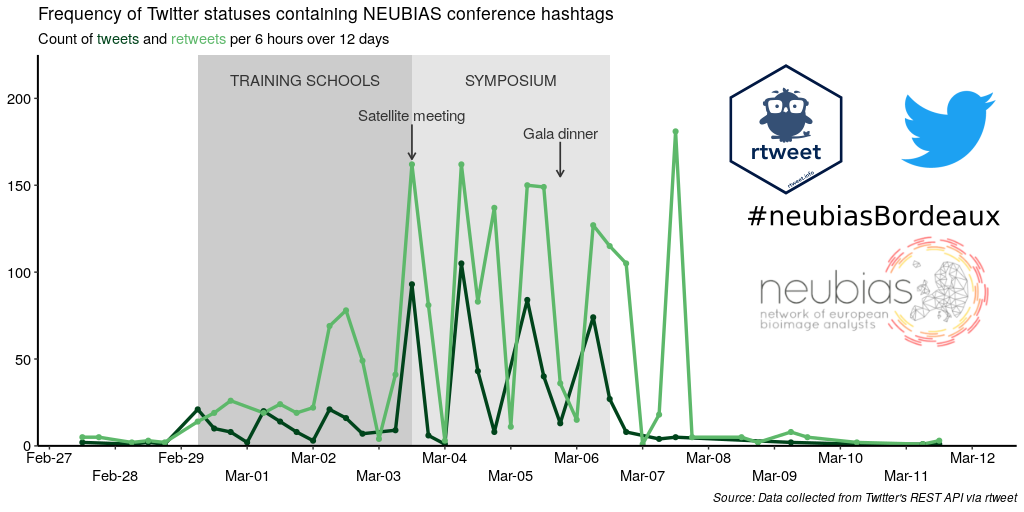
Part 1: Collecting Twitter statuses related to a scientific conference
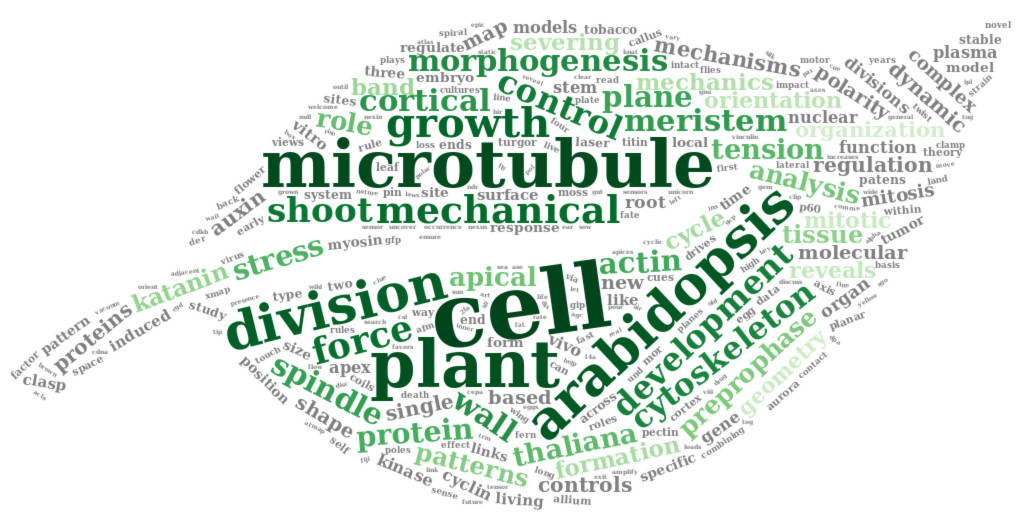
Plots and wordclouds on the references gathered during my PhD thesis
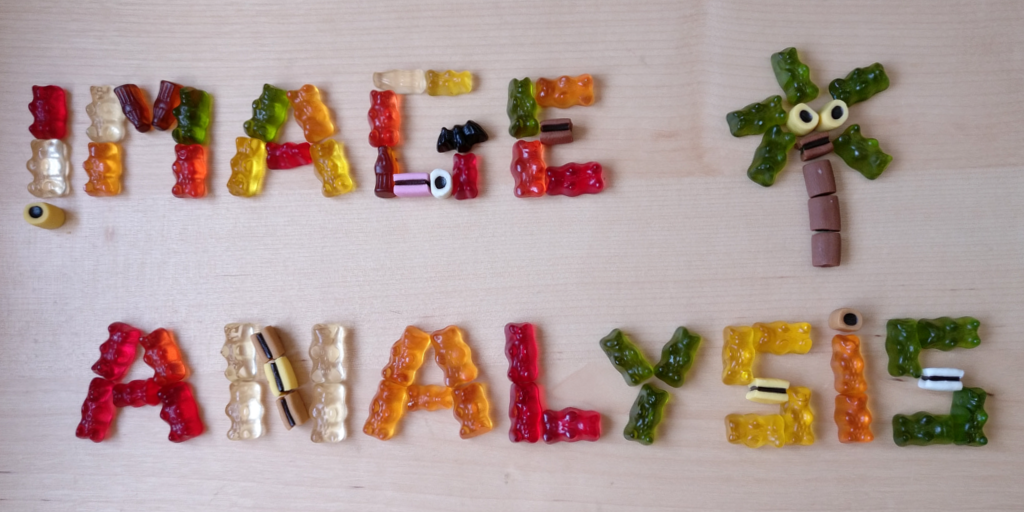
Teaching image and data analysis with candies

Marion Louveaux website
I am application specialist and data scientist. I do image and data analyses.
learn more