

Visualising GPX hiking data and photos with leaflet
Visualising GPX hiking data and photos with leaflet
In this article, I use a {leaflet} interactive map to display a hiking trail and position photographs of the landscape using pop-ups.
This summer, I went to Brittany, in a region called “Golfe du Morbihan”. Golfe is the French translation for gulf and Morbihan means “little sea” in briton. In the gulf, there is many islets, some inhabited, others not, all very beautiful. I went hiking for the day on the largest islet, called the “île aux moines”. I had with me my camera and an hiking app called ViewRanger to record my GPS track. As I love playing with data, I immediately thought: why not try to position my pictures on the map once back home?
In the article below, I explain how to load the .gpx hiking track file in R, how to visualise it with {leaflet} and how to display on the map, using pop-up windows, the pictures I took at the geographical location they were taken. To position the pictures, I compare the timestamp present in the file metadata to the timestamp of the track points.
library(dplyr)
library(ggplot2)
library(leaflet)
library(leafpop)
library(lubridate)
library(purrr)
library(readr)
library(sf)
library(tibble)
library(tidyr)
Load GPX track
First, I load in R the .gpx hiking track file created by ViewRanger, a smartphone hiking app, using the st_read() function from the package {sf}.
Download the .gpx file as follows or click here: 20200903_ile_aux_moines.gpx:
curl::curl_download("https://marionlouveaux.fr/blog/2020-10-24_gpx_tracks_and_leaflet_map/20200903_ile_aux_moines.gpx",
                    destfile = "20200903_ile_aux_moines.gpx")
# assign filename
gpx_file <- "20200903_ile_aux_moines.gpx"
The function st_layers() tells me that the .gpx file contains several layers. I will use only the track_points layer.
st_layers(gpx_file)## Driver: GPX
## Available layers:
## layer_name geometry_type features fields
## 1 waypoints Point 0 23
## 2 routes Line String 0 12
## 3 tracks Multi Line String 1 13
## 4 route_points Point 0 25
## 5 track_points Point 1326 26Then, I rearrange the hiking track data. I separate the time column into a date and timepoint column to facilitate the comparison later with the picture metadata. And I plot the track with {ggplot2}.
track1 <- read_sf(gpx_file, layer = "track_points") %>%
  separate(col = time, into = c("date", "timepoint"), sep = " ", remove = FALSE)

ggplot(track1) +
  geom_sf() +
  theme_bw()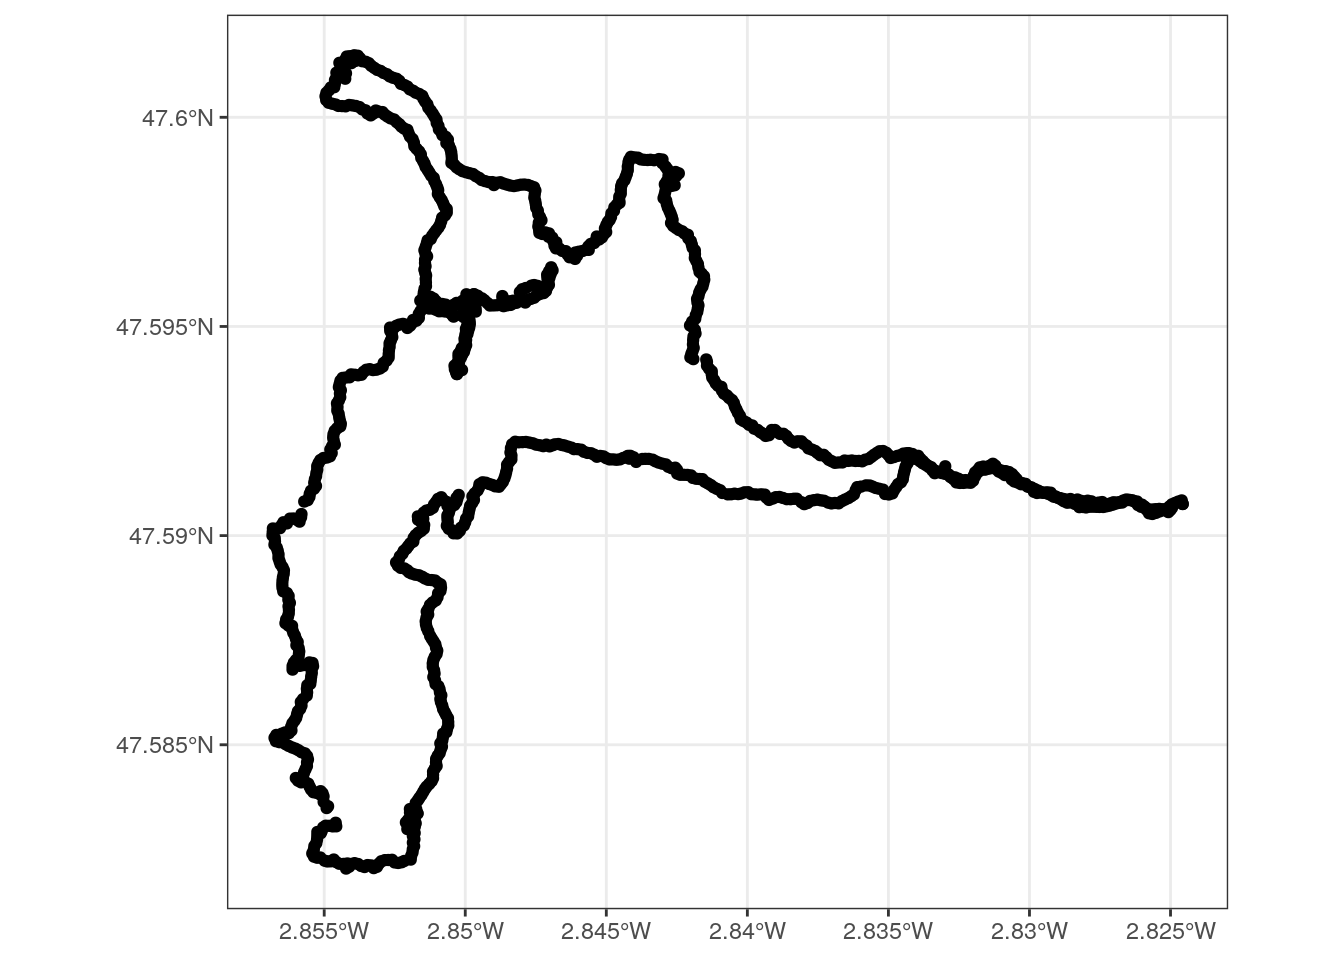
Display a leaflet map background
I chose {leaflet} interactive maps to have the possibility to display my pictures in pop-ups and zoom in and out of the map. The R package {leaflet} provides an interface to the Leaflet JavaScript library.
I use the function leaflet() to create a leaflet map and addProviderTiles() to add a map background. Many map providers exist. To choose a map background, I use this website, which proposes a preview of map backgrounds from leaflet providers. To illustrate the diversity of map backgrounds in this article, I will first use Stamen.Watercolor, a rather artistic background, and then OpenStreetMap.France, which is more accurate and easy to read.
map_leaflet <- leaflet() %>%
  addProviderTiles('Stamen.Watercolor')

map_leaflet
Add a hiking track on a {leaflet} map
I can now add the hiking track to the {leaflet} map. I convert the points that make up the hiking trail into a line using st_combine() and st_cast(), and then I convert the line to an {sf} object using st_sf().
track2 <- track1 %>%
  st_combine() %>%
  st_cast(to = "LINESTRING") %>%
  st_sf()
I add the line of the hiking track to the {leaflet} map with addPolylines().
map_leaflet <- leaflet() %>%
  addProviderTiles("Stamen.Watercolor")

map_leaflet %>%
  addPolylines(data = track2)
Add pop-ups on a {leaflet} map to display the pictures of the hike
I wanted to add the pictures I had taken during the hike with my camera on the {leaflet} map. The metadata of my pictures files don’t contain directly a GPS position, but they contain a creation timestamp. I can use this timestamp to join the pictures to their geographical coordinates on the hiking track. I also create a .csv file to store a nice title for each picture.
The pictures I use and the .csv file can be downloaded using the commands below (unfold the code chunk by clicking on the “code” button).
The photo zip file can be downloaded as follows or by clicking here: images.zip.
The csv metadata file can be downloaded as follows or by clicking here: photo_titles.csv
# pictures
curl::curl_download(url = "https://marionlouveaux.fr/blog/2020-10-24_gpx_tracks_and_leaflet_map/images.zip",
              destfile = "images.zip")
unzip("images.zip")
dir_path <- "images"
photo_path <- list.files(dir_path, full.names = TRUE)

# photo titles
curl::curl_download("https://marionlouveaux.fr/blog/2020-10-24_gpx_tracks_and_leaflet_map/photo_titles.csv",
                     destfile = "photo_titles.csv")
photo_titles <- read_csv("photo_titles.csv")
Here I need to correct the creation time of my pictures prior to adding them to the map, as I didn’t set the clock of my camera prior to the hike.
photos_metadata <- tibble(photo_path = photo_path) %>%
  mutate(info = map(photo_path, ~ file.info(.x)),
         photo_name = basename(photo_path))  %>%
  unnest(info) %>%
  select(photo_name, mtime) %>%
  inner_join(photo_titles, by = "photo_name") %>%
  mutate(corrected_mtime = mtime - duration(68, "minutes"),
         photo_path_leaflet = file.path(dir_path, photo_name))
Then, I need to join each picture to the nearest point available in the hiking track data. To do so, I look for the smallest absolute difference between the corrected creation timestamp of the picture and the timestamp of the hiking track points.
#' Match a given timestamp with the closest timestamp in a vector of timestamps
#'
#' @param track1 .gpx track imported in R (track point data)
#' @param photo_time picture creation time
#'
#' @return
#' @export
#'
#' @examples
closest <- function(track1, photo_time) {
difftime(track1$time, photo_time) %>%
abs() %>%
which.min() %>%
track1[., ]
}
photos_metadata_sf <- photos_metadata %>%
mutate(closest_point = map(corrected_mtime, ~closest(track1, photo_time = .x) )) %>%
unnest(cols = closest_point) %>%
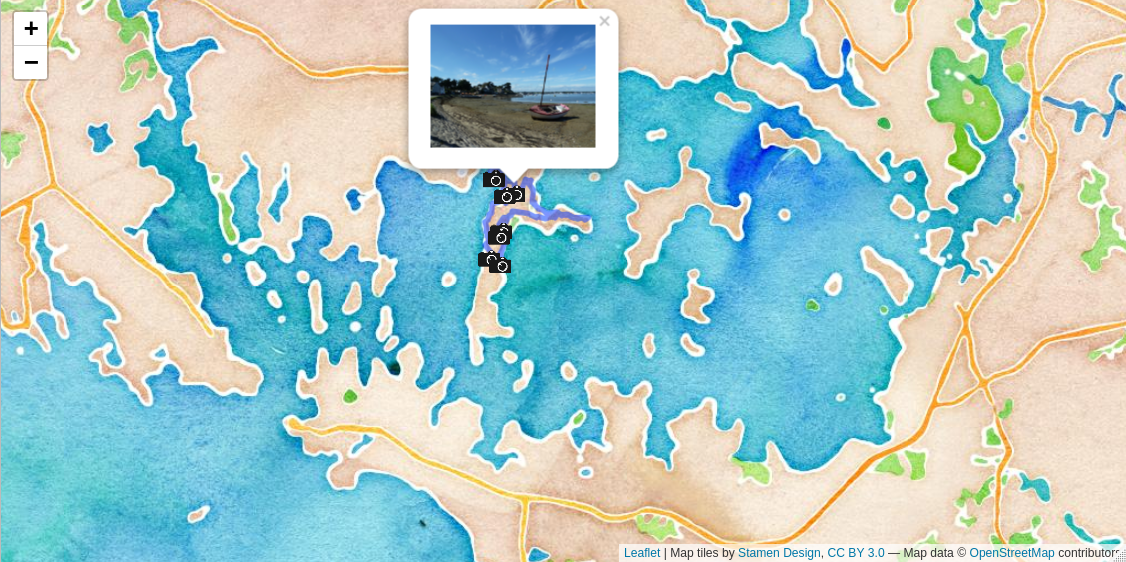
st_as_sf()Now I can add the pictures to the {leaflet} map. To do so, I use the function addMarkers() to add a camera icon and the function addPopupImages() from the {leafpop} package to display the picture as a pop-up window. The icon comes from Wikimedia and can be downloaded using the command below or by clicking here: 240px-Icone_appareil_photo.png
curl::curl_download(url = "https://marionlouveaux.fr/blog/2020-10-24_gpx_tracks_and_leaflet_map/240px-Icone_appareil_photo.png",
                    desfilte = "240px-Icone_appareil_photo.png")
cameraIcon <- iconList(makeIcon("240px-Icone_appareil_photo.png", iconWidth = 30))
leaflet() %>%
addProviderTiles("OpenStreetMap.France") %>%
addPolylines(data = track2) %>%
addMarkers(data = photos_metadata_sf, label = ~title, group = "photos", icon = ~cameraIcon) %>%
addPopupImages(photos_metadata_sf$photo_path_leaflet, group = "photos", width = 500) Conclusion
In this article, I explained how to visualise a hiking track and associated pictures on an interactive map. I created an interactive map with {leaflet}, imported the track from the .gpx file on the {leaflet} map background and then added the pictures as pop-up windows on to the map, at the geographical coordinates where the pictures were taken.
Acknowledgements
I could get grips on {leaflet} interactive maps thanks to this blog article (in French) from ThinkR.
Citation:
For attribution, please cite this work as:
Louveaux M. (2020, Oct. 24). "Visualising GPX hiking data and photos with leaflet". Retrieved from https://marionlouveaux.fr/blog/gpx-tracks-and-leaflet-interactive-map/.
@misc{Louve2020Visua,
    author = {Louveaux M},
    title = {Visualising GPX hiking data and photos with leaflet},
    url = {https://marionlouveaux.fr/blog/gpx-tracks-and-leaflet-interactive-map/},
    year = {2020}
  }

Twitter
Google+
Facebook
LinkedIn
Email