Visualising GPX hiking data and photos with leaflet
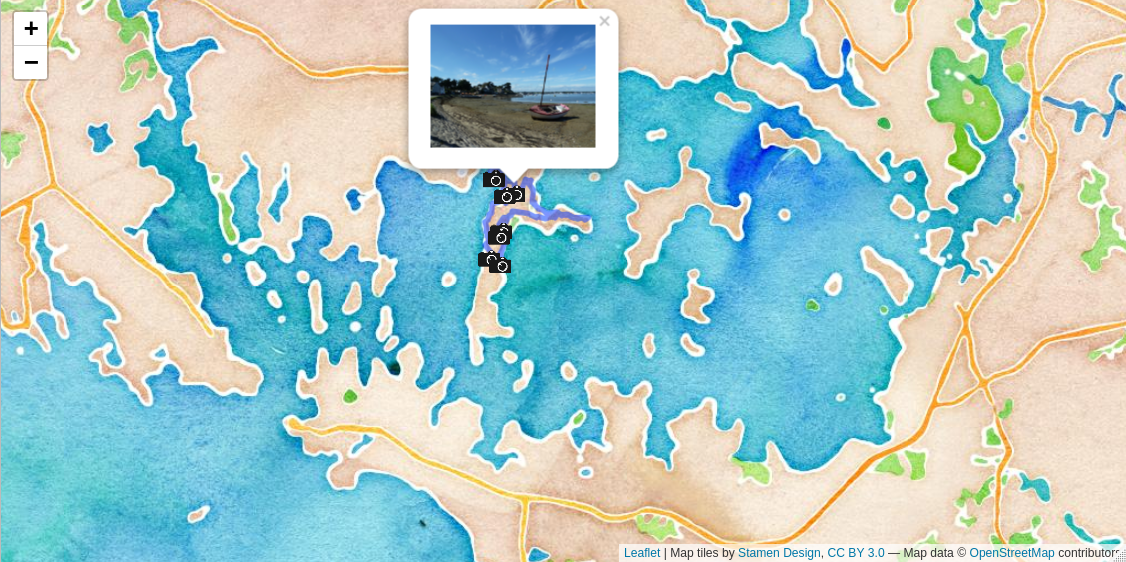
In this article, I use a {leaflet} interactive map to display a hiking trail and position photographs of the landscape using pop-ups.
This summer, I went to Brittany, in a region called “Golfe du Morbihan”. Golfe is the French translation for gulf and Morbihan means “little sea” in briton. In the … Read more
Analysing Twitter data: Exploring tweets content
Part 3: Exploring tweets content
In this blog article, I use the {rtweet} R package to explore Twitter user profiles and relationships between users from statuses collected during a scientific conference. This is the third and last part of my series “Analysing twitter data with R”. In the first part, I showed how I collected … Read more
Analysing Twitter data: Exploring user profiles and relationships
Part 2: Exploring user profiles and relationships
In this blog article, I use the {rtweet} R package to explore Twitter user profiles and relationships between users from statuses collected during a scientific conference. This is the second part of my series “Analysing twitter data with R”. In the first part, I showed how I collected Twitter … Read more
Analysing Twitter data with R
Part 1: Collecting Twitter statuses related to a scientific conference
In this blog article, I use the {rtweet} package to explore Twitter statuses collected during a scientific conference. I divided this article into three parts. This is part 1.
Twitter is one of the few social media used in the scientific community. Users having a scientific Twitter profile … Read more
Analysing bibliographical references with R
Plots and wordclouds on the references gathered during my PhD thesis
During my PhD, I worked at the intersection between biophysics and plant development. My PhD topic was focused on the study of the contribution of mechanical stress to cell division. To explore this topic, I did a lot of confocal microscopy, but also a lot of bioimage analysis and data analysis. I … Read more
Raising public interest in the microscopic world
Feedbacks from my experience at the 2018 European researcher's night
I took part in the 2018 edition of the European Researcher’s Night, an outreach event happening every year all over Europe at the end of September, and funded by the Marie Curie Actions. I joined some of my colleagues from my research institute, the Centre for Organismal Studies (COS), to animate an … Read more
Candy phenotyping
Teaching image and data analysis with candies
Teaching image and data analysis requires to choose an example dataset. Finding a simple numerical and/or text dataset is usually not an issue: such data can be found online, in public databases, or along with the analysis software, as this is the case with the library {datasets} of the statistical … Read more
Lateral root induction with Arduino
How to use a simple programming Arduino device to simplify biologists life
In my current lab, we are working on the formation of lateral roots of the model plant Arabidopsis thaliana. For some experiments, we need to observe precise events of the development in a large population of plants, or to synchronize the development of lateral roots over many plants. To do so, we … Read more
Welcome
Welcome on my blog
I am happy to start my #hugo #blogdown website with this first post!
I am a biology researcher, studying developmental processes in plants. I like fluorescence microscopy, especially when I can do live imaging in 3D. I enjoy a lot programming and making image analysis workflows. And I can’t imagine … Read more